School Trip Excel Template – Free Budget (2026)
9
Free download
Track UK revenue, targets, profit, customers and team performance with this practical KPI dashboard Excel template.


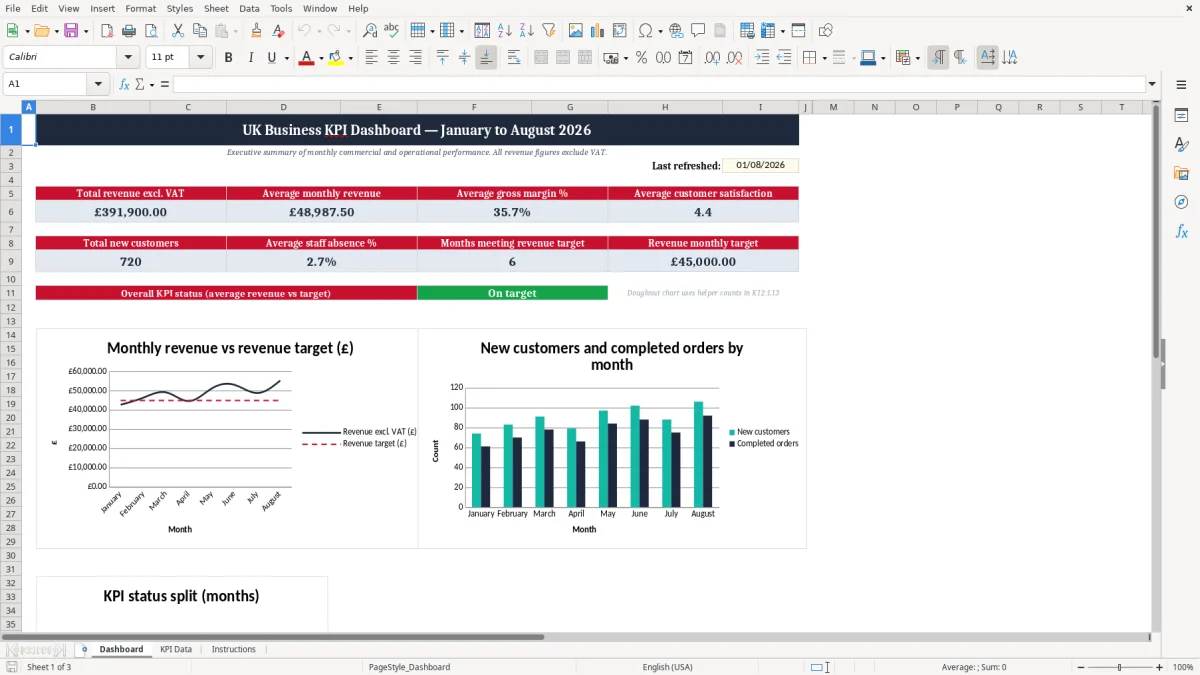
This KPI dashboard Excel template helps UK businesses turn monthly performance data into clear, useful management insight. Record revenue excluding VAT, targets, gross profit, gross margin, new customers, completed orders, customer satisfaction, staff absence and order conversion in one structured workbook.
The template is suitable for small businesses, sales teams, operations managers, finance teams and department leaders who need a straightforward way to monitor results and discuss actions.
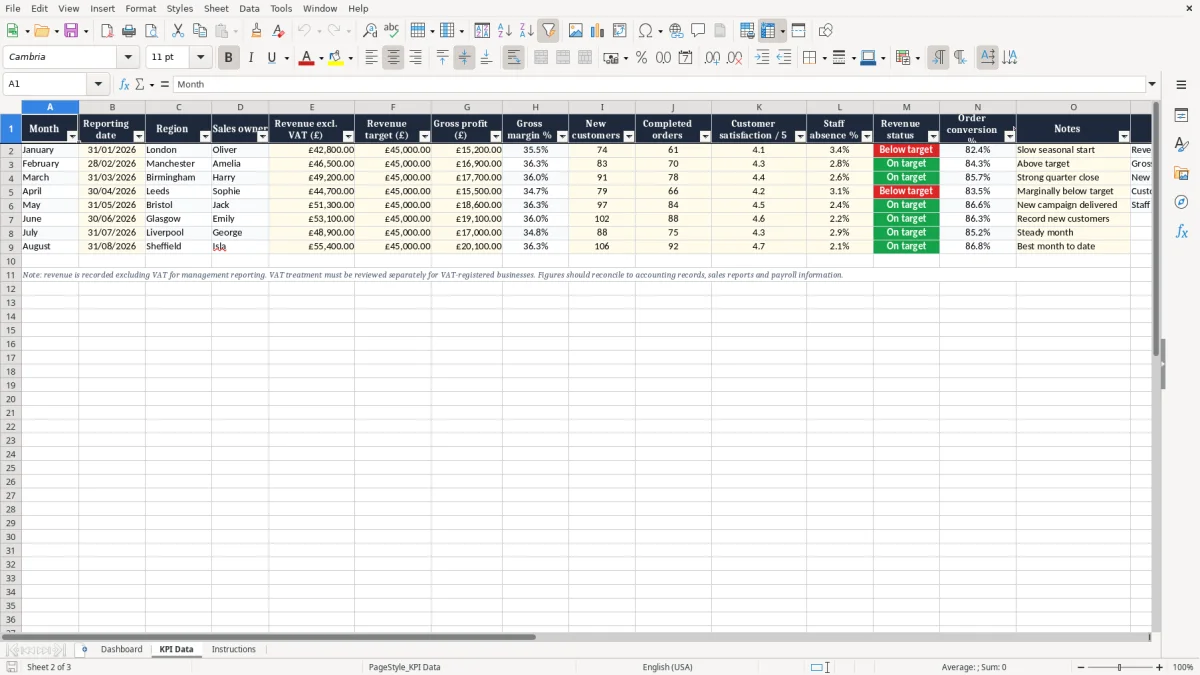
Open the workbook and begin with the Instructions or Dashboard worksheet. On the KPI Data worksheet, enter one row for each reporting period. Add the month, reporting date, region, sales owner and relevant KPI results.
Record revenue excluding VAT and use consistent definitions for gross profit, gross margin, customer satisfaction, staff absence and order conversion. Replace the example data with your own figures while keeping historical rows unchanged so that trends remain reliable. Use the Notes column to explain seasonal changes, campaigns, operational issues or other unusual results.
Return to the Dashboard after updating the data to review headline measures, charts and target performance. Discuss significant movements with the relevant KPI owner and record any follow-up actions in your normal management process.
The workbook can be adapted for weekly, monthly or quarterly reporting, although monthly updates are a practical choice for many UK businesses. If you add new measures, create additional columns in the data table and update any dashboard formulas or charts that should display them.
A KPI dashboard Excel template is a ready-to-use workbook for collecting, organising and reviewing key performance indicators. Instead of keeping figures in separate files or relying on informal updates, a dashboard brings important measures together in a consistent format. This makes it easier to compare actual performance with targets, understand movement over time and decide where attention is needed.
The template is designed around practical measures used by UK businesses, including revenue excluding VAT, revenue target, gross profit, gross margin, new customers, completed orders, customer satisfaction, staff absence and order conversion. It also includes reporting date, region, sales owner and notes fields so that results have useful business context. Excel is a flexible choice for organisations that want a familiar tool without introducing specialist business intelligence software.
Users can replace the example figures, add reporting periods and adapt labels to match internal definitions. A clear data-entry table supports more reliable monthly reporting because each period follows the same structure. The Dashboard worksheet provides a summary for management discussions, while the KPI Data worksheet remains the source for the underlying figures.
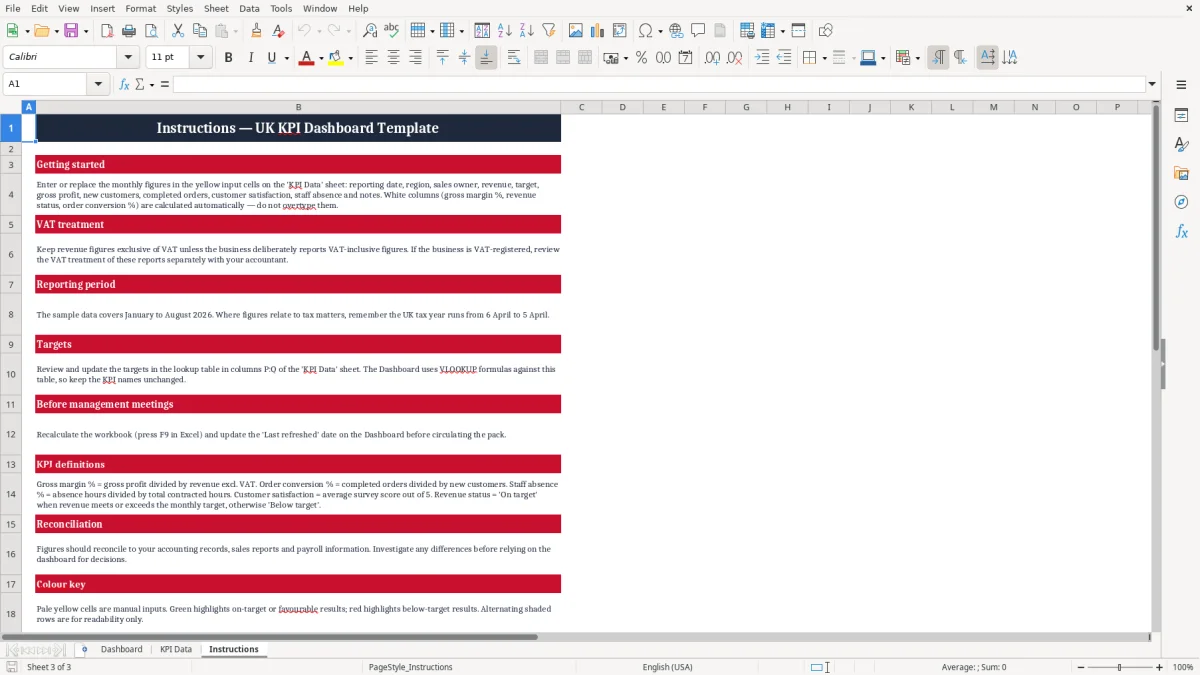
The Instructions worksheet explains how to update the workbook and interpret the main areas. This format can support a regular management meeting, a sales review, a quarterly business review or a simple owner-led performance check.
It is not a replacement for accounting records or formal HR systems, but it can provide a useful operational overview when figures from those systems have been checked and prepared. By keeping measures and reporting periods together, teams can identify trends, ask better questions and create a repeatable process for reviewing business performance.
UK businesses often need performance reporting that reflects local financial and operational conventions. This Excel KPI dashboard uses pound sterling values for revenue, revenue targets and gross profit, and it is intended to record revenue excluding VAT. Excluding VAT helps create a more consistent comparison when VAT is collected on behalf of the government and is not treated as business income.
Businesses should still follow their accountant’s guidance and use their finance system for official tax records. The dashboard can be used by a small business owner, commercial manager, sales director, finance team or operations lead. Regional fields allow results to be associated with locations such as London, Manchester, Birmingham, Leeds, Bristol, Glasgow, Liverpool or Sheffield, while the sales owner field can identify the person responsible for a result.
These fields can be replaced with your own branches, territories, teams or departments. Monthly reporting dates provide a simple basis for tracking seasonal patterns, campaign effects and changes in customer demand. The example data demonstrates how revenue may move above or below a £45,000 target, but users should replace that figure with targets approved for their own organisation.
Consistent definitions are important. Decide whether gross profit includes the same cost categories each period, confirm how conversion is calculated and agree the population used for staff absence and customer satisfaction.
When definitions remain stable, the dashboard becomes more useful for comparison and less likely to produce misleading conclusions. A short written KPI dictionary can help new users understand exactly what each field means before they enter data.
A short written KPI dictionary can help new users understand exactly what each field means before they enter data, and a task tracker template can then capture the actions needed to keep those definitions consistent.
A well-maintained KPI dashboard can improve the quality and speed of management reporting. Its main benefit is focus: decision-makers can see the measures that matter without searching through multiple spreadsheets. Revenue and target figures show whether commercial activity is meeting expectations, while gross profit and gross margin help reveal whether sales are producing an acceptable return.
New customers and completed orders provide indicators of demand and delivery volume. Order conversion can help a sales team understand how effectively opportunities become completed business. Customer satisfaction adds a service perspective, and staff absence provides context about workforce availability and operational resilience.
Looking at these measures together is often more informative than reviewing any one figure in isolation. For example, higher revenue may be accompanied by weaker gross margin, or strong order volume may coincide with lower customer satisfaction. The Notes field allows users to explain those relationships by recording campaigns, seasonal changes, staffing issues or exceptional events.
Regional and sales owner information can support more focused conversations, although comparisons should account for differences in market size, role, territory and reporting quality. The workbook can create a repeatable rhythm for monthly reviews. Before a meeting, the owner updates the data, checks unusual movements and prepares questions.
During the meeting, managers can agree actions and assign responsibility. Afterward, the next reporting cycle provides a basis for checking progress. The template works best when it supports discussion rather than becoming a scorekeeping exercise.
Teams should use it to understand performance, learn from results and make practical decisions. Clear ownership also reduces delays and helps ensure that unusual results receive timely attention.
The template is designed to be adapted to different UK organisations and reporting processes. Start by reviewing the KPI Data worksheet and replacing the sample rows with your own figures. Keep the column headings if they match your reporting needs, or add columns for measures such as average order value, customer retention, refunds, operating costs, website leads or delivery performance.
If a new measure should appear on the Dashboard, update the relevant formulas, summary cells or charts after adding it to the data table. Use consistent date formats and agree whether reporting periods represent calendar months, financial months or another cycle. The Region and Sales owner fields can be renamed or repurposed for branches, departments, account managers, product groups or project leads.
Notes should be brief but specific enough to explain material changes. For example, a note might identify a marketing campaign, supplier delay, staff shortage or one-off order. Before publishing results, check that revenue is entered excluding VAT, percentages are formatted correctly and all figures use the intended period.
Protecting formula cells can help prevent accidental changes when the workbook is shared, while keeping input cells clearly identified makes routine updates easier. Save dated versions or maintain a controlled master file so that historical reporting can be reviewed. The Dashboard is most effective when its audience understands each measure and the action expected from a result outside target.
Add your organisation’s branding if appropriate, but keep the layout readable and avoid adding visual elements that obscure the data. A short review of definitions and ownership each quarter can help keep the workbook accurate as the business changes. Test new formulas with sample values before relying on them in a formal report.
The workbook includes Dashboard, KPI Data and Instructions worksheets. It tracks revenue excluding VAT, targets, gross profit, gross margin, new customers, completed orders, customer satisfaction, staff absence and order conversion.
Yes. It uses pound sterling values and is designed for practical UK business reporting. Revenue is recorded excluding VAT, while official tax records should remain in your accounting system.
Yes. Replace the example regions and sales owners with your own locations, departments, territories or team members.
Monthly updates are suitable for many management reporting processes, but the workbook can be adapted for weekly or quarterly reporting when the underlying data is available.
Yes. Add new columns to the KPI Data worksheet and update dashboard formulas or charts if you want those measures included in the visual summary.
No. It provides a management reporting overview and should complement, not replace, accounting, payroll, HR or customer systems.
Excel template by
Guide written by